Problem
The purpose of this analysis is to take a set of data and perform statistical that will later allow us to predict future values. We again use Google’s closing stock price for the past eleven years and a generic speech signal to perform our tests on.
The first task has us plot the average stock price for every week in those eleven years. We then fit a linear regression to the data to see the general trend of the stock price. What do these plots tell us about Google’s stock? How do the two plots relate to one another and how can we use this analysis to help us better invest in Google? In the next task we take a speech signal and plot its histogram. We set some parameters such as using a bin size of 10 and setting the range to be between ±32767 since our signal is stored in 16 bit integers. Then we normalize the data in each bin by dividing by the total number of samples in the entire signal. We compare this histogram to a cumulative distribution function (CDF). Again how can we use these histograms to better understand our speech signal?
Approach and Results
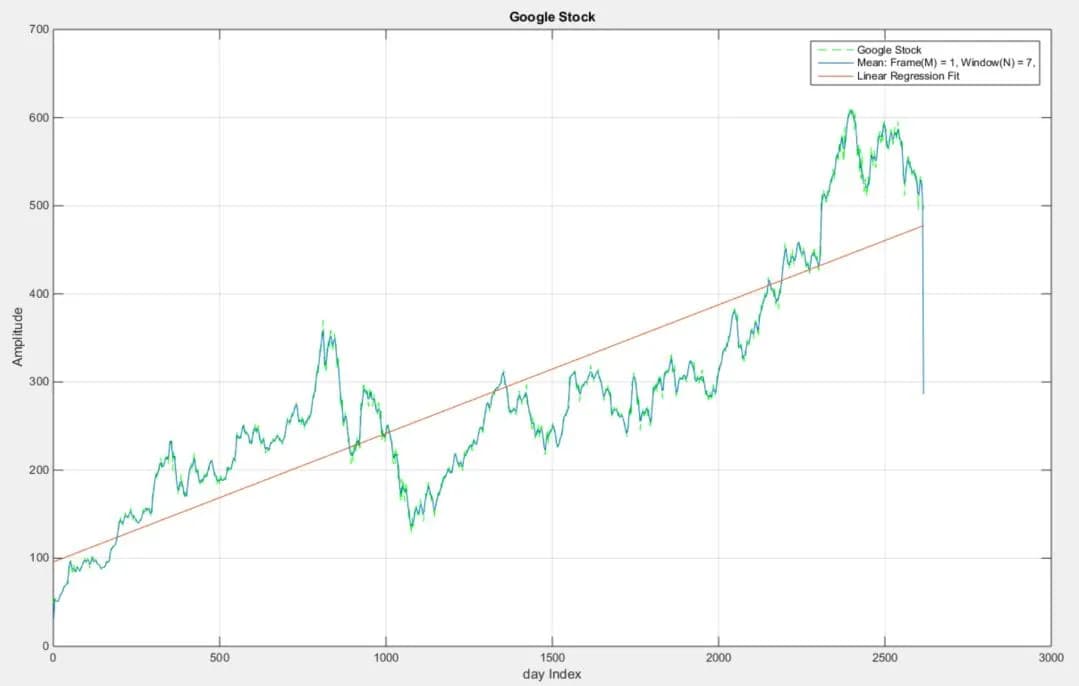
In the last assignment we learned how to load in external data into MatLab. We utilize this procedure to load in our Google data. We then perform similar functions we explore previously to find a mean value of the stock data in periods of 7 days at a time (window = 7) with 1 day intervals (frame = 1). Now we fit a linear regression to the data to see a trend.
Google’s stock in the past few years has overall had a positive trend. Comparing the trend line to the stock price we can determine certain time periods where it was beneficial to purchase stock. Anytime Google stock is below the trend line we can say it is a good time to buy stock. Anytime the stock price is above the trend line we say you should sell. The problem with this thought process is that we can only compute this trend line if we know the actual data. We can interpret the trend line into the future but now we are guessing. The best model can never take into account outlier events that can drastically change the overall trend. You can have a prediction model that can take into account various parameters but no one model is perfect.