Problem
In assignment eight we switch over to programming-python scripting in which we will reproduce our results we found in homework assignment number one but using programming-python. Reiterating homework one goals:
In this first assignment of the semester we simply want to familiarize ourselves with command line tools. We start by learning how to personalize our Linux configuration by editing the .bash_profile and
.bashrcfiles in~/. Aliases and manipulating the environment path allow us to run
commands from any directory on our machines.
- Edit the environment path so a
hello worldcommand can be ran from any directory. Then create an alias by modifying the .bash_profile.We then switch gears and learn some commonly used commands. Commands like
grep,find,wc,echo, etc. are powerful commands that we should know. Specifically we will work with a large data set of clinical EEGs and query for three cases:
- Patient Names whose first names start with R and last names start with S who had an EEG in the date range 2010-13
- EEG reports that contain the word ‘spike’. EEG reports that contain the word ‘seizure’. We then produce a histogram of the words in these reports.
- For EEG reports that contain the word ‘spike’ produce a histogram of bi-grams.”
So now instead of using grep, find and wc we need to find similar
tools in programming-python that accomplish the same results. The one item we will
still leave in bash in generating a list of all the file in our /data/
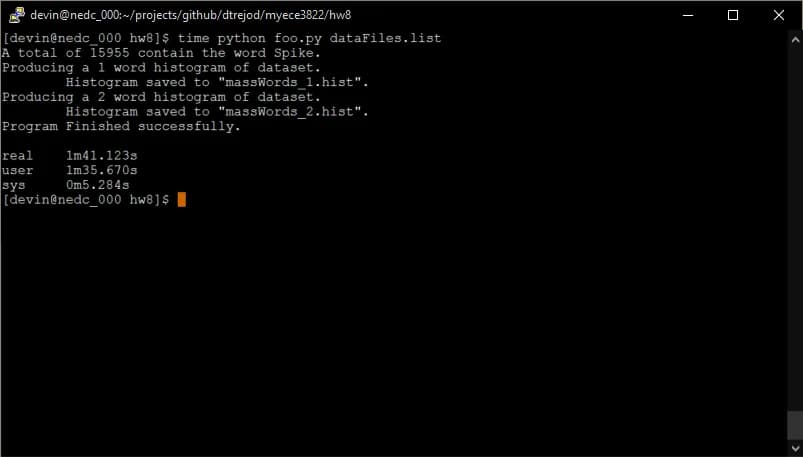
directory. In the end we will time and compare the results of homework one
to the performance seen when using this programming-python approach.
Approach
To begin we need to find tools that accomplish the same goals in programming-python that we find in bash. To begin we generate a list of files in bash using the same script we used in homework one. Generating a list of file in programming-python is also possible but we ignore this aspect of the assignment for this homework. Since we already have a list of files we are then tasked with reading this list of files into a programming-python list or other type.
After having all the file location stored in memory from running our programming-python
script we can begin our analysis of the data. We found that one of the
better data types to work with is Pandas. Pandas is similar to having
excel functionality within programming-python. Specifically a data frame is a table
that can be used within the programming-python coding language. Our approach starts
with loading each filename into the first column of a dataframe.
To simplify things we house this dataframe within its own class called
wordCounts. The class has functions that will manipulate our list of
files within our EEG directory.
The first function in our custom class is read. Read simply reads in a list of files and stores its filename in the first column of dataframe. Read will also take the filename and read in the contents of the file into the second column which we name “contents”.
A second function in our class called dropNotContain will drop any file
whose column “contents” does not contain the “specialWord” argument used
when the function is called. The second argument in our function “drop”
will specify whether we drop the rows whose contents do not contain the
“specialWord”. If drop is false we simply only report the number of rows
contain the word asked for in the “specialWord” argument. In our case we
will look for a “specialWord” whose value equals “spike” and drop = “True”.
The third function we use is createHistogram which will create a
histogram of all words in the data column “contents” over a span of a
number word contained in the argument “span”. So if span = 1 then we
will create a one word histogram, if span = 2 then we will create a two
word histogram, and so on. This functionality is similar to the
$ tail –n +2 words | paste words | sort | uniq –ic | sort –nr >subseta_bi.hist
command we would use in bash to create a two word histogram. However in programming-python we use the string functions “join” to combine multiple column “contents” together. Then we split each word into a list of words. If necessary we can combine to adjoining words together again using the “join” string library function. Lastly we take advantage of the collections module to find a histogram of the words inside our resulting dataframe.
What is interesting is whether the programming-python or bash result is faster. We will find out.