Problem
In class assignment five we work with random variables (different portions of our speech signal) and compute how similar the two data sets are. In chapter five we introduce covariance and correlation.
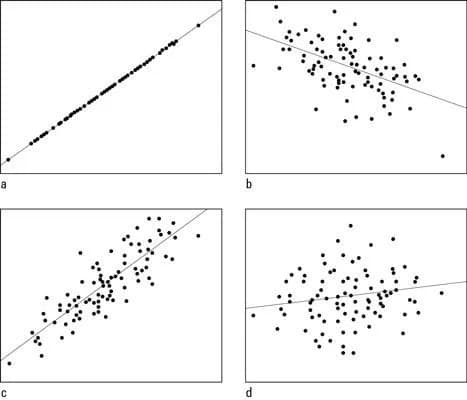
A correlation coefficient tells us how closely related two sets of data are. A coefficient of zero says us there is no correlation between the two sets of data. We can say the two sets of data are independent. As we increase positively up to one it tells us both sets of change positively at similar rates. A coefficient of one says the increase exactly meaning the two are exactly correlated. Negative coefficients say the as one data set increase the other decreases. If you obtain -1 it says that as one data set increases the other decreases at the same rate. Covariance is similar except it tells us the magnitude of the change. It still measures how two data sets change with respect to one another.
For the assignment we are tasked with finding the correlation and
covariance of our speech signal where one data set is 240 and the other is
240 samples shifted over by k. K ranges from 0 to 512. We find correlation
for time = 0.9secs and time = 3.0secs.
Next with find the covariance of the data sets shifted over by i and j samples. We again take 240 samples for each data set. The covariance is given by the two data sets multiplied together and summed for each 240 samples.
Covariance is calculated over the signal starting at times starting are
0.9, 3.0 and 1.1 seconds.
Approach and Results
To begin we find the correlation of the signal at time =0.9secs. Recall
the correlation will range from −1 → 1 and will be zero if the shifted
signal does not appear to have any relationship to the non-shifted portion
of the signal. First let us look at our non-shifted portion of the signal
or the 240 samples after time = 0.9secs.
For this analysis we will take this sample of the signal and compared it with shift k starting at 0 and range up to 512.
First characteristics to notice about the correlation is how it appears
periodically shift between positive correlation to negative. Given that
the composition signal is a sum of sine waves we see that at some point
the shift will cause enough shift so that there is similar sine wave
composition between the two compared sample ranges. Take for example when
k = 100.